March 15, 2021
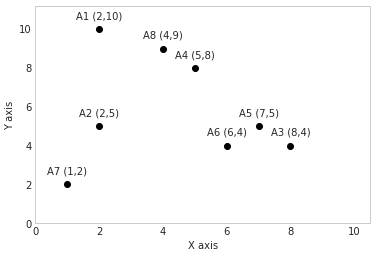
Find the K-means clusters for the given the dataset and K=3.
A1 = (2,10)
A2 = (2,5)
A3 = (8,4)
A4 = (5,8)
A5 = (7,5)
A6 = (6,4)
A7 = (1,2)
A8 = (4,9)

import matplotlib.pyplot as plt
%matplotlib inline
plt.style.use('seaborn-whitegrid')

x_coordinates = [2,2,8,5,7,6,1,4]
y_coordinates = [10,5,4,8,5,4,2,9]
points = ['A1','A2','A3','A4','A5','A6','A7','A8']

# graph configuration
plt.grid(b=None)
plt.xlabel('X axis')
plt.ylabel('Y axis')
plt.xlim([0,10.5])
plt.ylim([0,11.2])

# labels!
for point, x, y in zip(points, x_coordinates, y_coordinates):
    label = f"{point} ({x},{y})"
    plt.annotate(
        label,
        (x,y),
        textcoords="offset points", # how to position the text
        xytext=(0,10), # distance from text to points (x,y)
        ha='center' # horizontal alignment
    )

# plot!
fig = plt.plot(x_coordinates, y_coordinates, 'o', color='black')
Let's select three numbers between 0 and the length of the dataset.
import random
indexes = random.sample(range(1, len(x_coordinates) + 1), 3)
indexes
>>> [1, 4, 7]
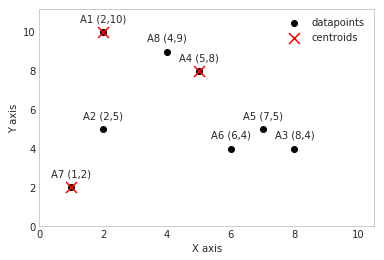
This means that A1, A4, and A7 have been selected to be our initial centroids.
import matplotlib.pyplot as plt
%matplotlib inline
plt.style.use('seaborn-whitegrid')

x_coordinates = [2,2,8,5,7,6,1,4]
y_coordinates = [10,5,4,8,5,4,2,9]
centroids_x = [2,5,1]
centroids_y = [10,8,2]
points = ['A1','A2','A3','A4','A5','A6','A7','A8']

# plot!
fig = plt.figure()
ax = fig.add_subplot(111)

# graph configuration
plt.grid(b=None)
plt.xlabel('X axis')
plt.ylabel('Y axis')
plt.xlim([0,10.5])
plt.ylim([0,11.2])

# labels!
for point, x, y in zip(points, x_coordinates, y_coordinates):
    label = f"{point} ({x},{y})"
    ax.annotate(
        label,
        (x,y),
        textcoords="offset points", # how to position the text
        xytext=(0,10), # distance from text to points (x,y)
        ha='center' # horizontal alignment
    )

ax.scatter(
    x_coordinates, y_coordinates, marker='o',
    color='black', label='datapoints'
)
ax.scatter(
    centroids_x, centroids_y, marker='x',
    color='red', label='centroids', s=120
)
ax.legend()
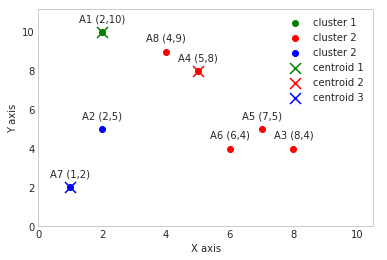
We calculate the distance between a given point and the three centroids. The point is then assigned to the cluster belonging to the centroid with the shortest distance.
The distance will be calculated by:
Distance(v1, v2) = ( (v1.x - v2.x)**2 + (v1.y - v2.y)**2 ) **.5
import matplotlib.pyplot as plt
%matplotlib inline
plt.style.use('seaborn-whitegrid')

points_names = ['A1','A2','A3','A4','A5','A6','A7','A8']

data_points = [[2,10], [2,5], [8,4], [5,8], [7,5], [6,4], [1,2], [4,9]]
x_coordinates = [point[0] for point in data_points]
y_coordinates = [point[1] for point in data_points]

centroid_1 = [2,10]
centroid_2 = [5,8]
centroid_3 = [1,2]

centroids = [centroid_1, centroid_2, centroid_3]

cluster_1 = []
cluster_2 = []
cluster_3 = []

def distance(v1, v2):
    return ( (v1[0] - v2[0])**2 + (v1[1] - v2[1])**2 )**0.5

for point in data_points:
    dist_c1 = distance(point, centroids[0])
    dist_c2 = distance(point, centroids[1])
    dist_c3 = distance(point, centroids[2])
    min_distance = min([dist_c1, dist_c2, dist_c3])
    if min_distance == dist_c1:
        cluster_1.append(point)
    elif min_distance == dist_c2:
        cluster_2.append(point)
    else:
        cluster_3.append(point)

cluster_1_x = [point[0] for point in cluster_1]
cluster_2_x = [point[0] for point in cluster_2]
cluster_3_x = [point[0] for point in cluster_3]

cluster_1_y = [point[1] for point in cluster_1]
cluster_2_y = [point[1] for point in cluster_2]
cluster_3_y = [point[1] for point in cluster_3]

# initiate the plot
fig = plt.figure()
ax = fig.add_subplot(111)

# graph configuration
plt.grid(b=None)
plt.xlabel('X axis')
plt.ylabel('Y axis')
plt.xlim([0,10.5])
plt.ylim([0,11.2])


# labels
for point_name, x, y in zip(points_names, x_coordinates, y_coordinates):
    label = f"{point_name} ({x},{y})"
    ax.annotate(
        label,
        (x,y),
        textcoords="offset points", # how to position the text
        xytext=(0,10), # distance from text to points (x,y)
        ha='center' # horizontal alignment
    )

# plot the data
ax.scatter(
    cluster_1_x, cluster_1_y, marker='o',
    color='green', label='cluster 1'
)
ax.scatter(
    cluster_2_x, cluster_2_y, marker='o',
    color='red', label='cluster 2'
)
ax.scatter(
    cluster_3_x, cluster_3_y, marker='o',
    color='blue', label='cluster 2'
)
ax.scatter(
    centroid_1[0], centroid_1[1], marker='x',
    color='green', label='centroid 1', s=120
)
ax.scatter(
    centroid_2[0], centroid_2[1], marker='x',
    color='red', label='centroid 2', s=120
)
ax.scatter(
    centroid_3[0], centroid_3[1], marker='x',
    color='blue', label='centroid 3', s=120
)
ax.legend()
New centroids can be calculated by finding the average point in a given cluster:
def new_centroid(cluster):
    length = len(cluster)
    mean_x = sum([x for x, _ in cluster])/length
    mean_y = sum([y for _, y in cluster])/length
    return [mean_x, mean_y]
Our new centroids will therefore be:
[2.0, 10.0]
[6.0, 6.0]
[1.5, 3.5]
Repeat steps 2. and 3. until the algorithm converges
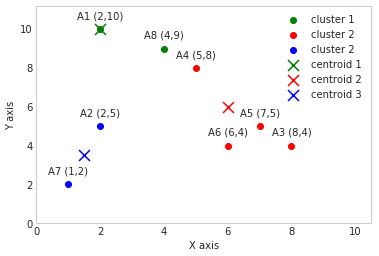
New centroids:
[3.0, 9.5]
[6.5, 5.25]
[1.5, 3.5]
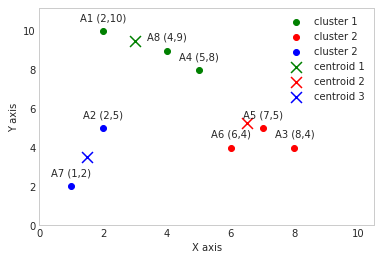
New centroids:
[3.6666666666666665, 9.0]
[7.0, 4.333333333333333]
[1.5, 3.5]

New centroids (same as previous step):
[3.6666666666666665, 9.0]
[7.0, 4.333333333333333]
[1.5, 3.5]
import matplotlib.pyplot as plt
%matplotlib inline
plt.style.use('seaborn-whitegrid')

points_names = ['A1','A2','A3','A4','A5','A6','A7','A8']

data_points = [[2,10], [2,5], [8,4], [5,8], [7,5], [6,4], [1,2], [4,9]]
x_coordinates = [point[0] for point in data_points]
y_coordinates = [point[1] for point in data_points]

centroid_1 = [3.6666666666666665, 9.0]
centroid_2 = [7.0, 4.333333333333333]
centroid_3 = [1.5, 3.5]

centroids = [centroid_1, centroid_2, centroid_3]

cluster_1 = []
cluster_2 = []
cluster_3 = []

def distance(v1, v2):
    return ( (v1[0] - v2[0])**2 + (v1[1] - v2[1])**2 )**0.5

for point in data_points:
    dist_c1 = distance(point, centroids[0])
    dist_c2 = distance(point, centroids[1])
    dist_c3 = distance(point, centroids[2])
    min_distance = min([dist_c1, dist_c2, dist_c3])
    if min_distance == dist_c1:
        cluster_1.append(point)
    elif min_distance == dist_c2:
        cluster_2.append(point)
    else:
        cluster_3.append(point)

cluster_1_x = [point[0] for point in cluster_1]
cluster_2_x = [point[0] for point in cluster_2]
cluster_3_x = [point[0] for point in cluster_3]

cluster_1_y = [point[1] for point in cluster_1]
cluster_2_y = [point[1] for point in cluster_2]
cluster_3_y = [point[1] for point in cluster_3]

# initiate the plot
fig = plt.figure()
ax = fig.add_subplot(111)

# graph configuration
plt.grid(b=None)
plt.xlabel('X axis')
plt.ylabel('Y axis')
plt.xlim([0,10.5])
plt.ylim([0,11.2])


# labels
for point_name, x, y in zip(points_names, x_coordinates, y_coordinates):
    label = f"{point_name} ({x},{y})"
    ax.annotate(
        label,
        (x,y),
        textcoords="offset points", # how to position the text
        xytext=(0,10), # distance from text to points (x,y)
        ha='center' # horizontal alignment
    )

# plot the data
ax.scatter(
    cluster_1_x, cluster_1_y, marker='o',
    color='green', label='cluster 1'
)
ax.scatter(
    cluster_2_x, cluster_2_y, marker='o',
    color='red', label='cluster 2'
)
ax.scatter(
    cluster_3_x, cluster_3_y, marker='o',
    color='blue', label='cluster 2'
)
ax.scatter(
    centroid_1[0], centroid_1[1], marker='x',
    color='green', label='centroid 1', s=120
)
ax.scatter(
    centroid_2[0], centroid_2[1], marker='x',
    color='red', label='centroid 2', s=120
)
ax.scatter(
    centroid_3[0], centroid_3[1], marker='x',
    color='blue', label='centroid 3', s=120
)
ax.legend()

def new_centroid(cluster):
    length = len(cluster)
    mean_x = sum([x for x, _ in cluster])/length
    mean_y = sum([y for _, y in cluster])/length
    return [mean_x, mean_y]

print(new_centroid(cluster_1))
print(new_centroid(cluster_2))
print(new_centroid(cluster_3))